
Stock Market Returns in Times of Interest Rate Volatility
27 July, 2024
The relationship between interest rate volatility and stock market performance has long intrigued economists and investors alike. The tendency of volatility regimes to persist and the higher volatility regimes association with lower forward returns are particularly notable. The main objective of this study is to examine how fluctuations in interest rates impact stock returns and their volatility, specifically within the context of the S&P 500 US equities. In this article I explore this relationship, utilizing empirical data and regression and GARCH analysis to uncover the nuances of this dynamic interaction.
Importance of the Study
The timing of this study is particularly pertinent given the current anticipation that the Federal Reserve may soon cut interest rates. Such a move is expected to have broad implications for the economy and financial markets, influencing everything from borrowing costs to investor sentiment. At the most basic level, volatility matters to investors because it increases risk and the chance of loss, especially for those who need to sell bonds before maturity. Interest rate volatility impacts different asset classes differently, and investors can benefit from being aware of these differences. By analyzing the historical relationship between interest rate volatility and stock returns volatility, this study provides insights that are crucial for navigating the current economic landscape.
Theoretical Framework
The relationship between interest rates and stock returns is theoretically grounded in several financial principles. According to the Discounted Cash Flow (DCF) model, the value of a stock is the present value of its expected future cash flows, discounted by the required rate of return. An increase in interest rates raises the discount rate, thereby reducing the present value of future cash flows and, consequently, the stock price.
Hypotheses
Based on the theoretical framework, the following hypotheses are posited:
- H1: Interest rate volatility negatively impacts stock returns.
- H2: Interest rate volatility increases the volatility of stock returns.
Methodology
In this article, I look into second hypotheses, focusing on forward returns to capture the predictive relationship between interest rate changes and stock market forward returns volatility. The study employs econometric models to analyze the data, with a specific emphasis on Generalized Autoregressive Conditional Heteroskedasticity (GARCH) models to account for volatility clustering in stock returns.
Data Collection
- Market Proxy: The return on the S&P 500 equity index, the widest equity market index in the USA, is used as a proxy for the market portfolio.
- Interest Rate Proxy: The cut-off implicit yield on 10-year Treasury Bills has been used as the interest rate variable because it is the deregulated interest rate in the USA which is determined by the forces of demand and supply.
Data Sources and Period of the Study
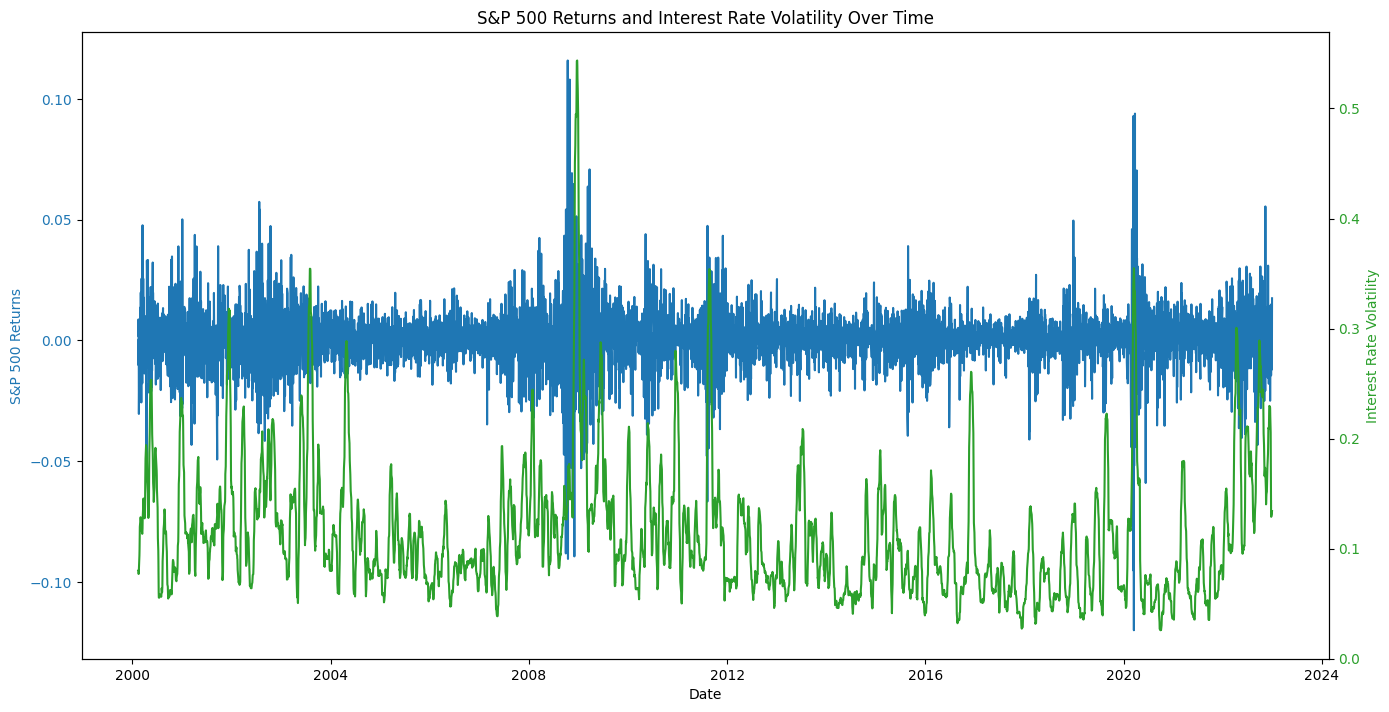
The period of the study spans from January 2000 to January 2023, covering various economic cycles, including the dot-com bubble, the financial crisis of 2008, and the COVID-19 pandemic. Interest rate data is proxied by the 10-year Treasury yield, while stock returns are derived from the S&P 500 index. Volatility is measured using a 30-day rolling standard deviation.
Regression Analysis
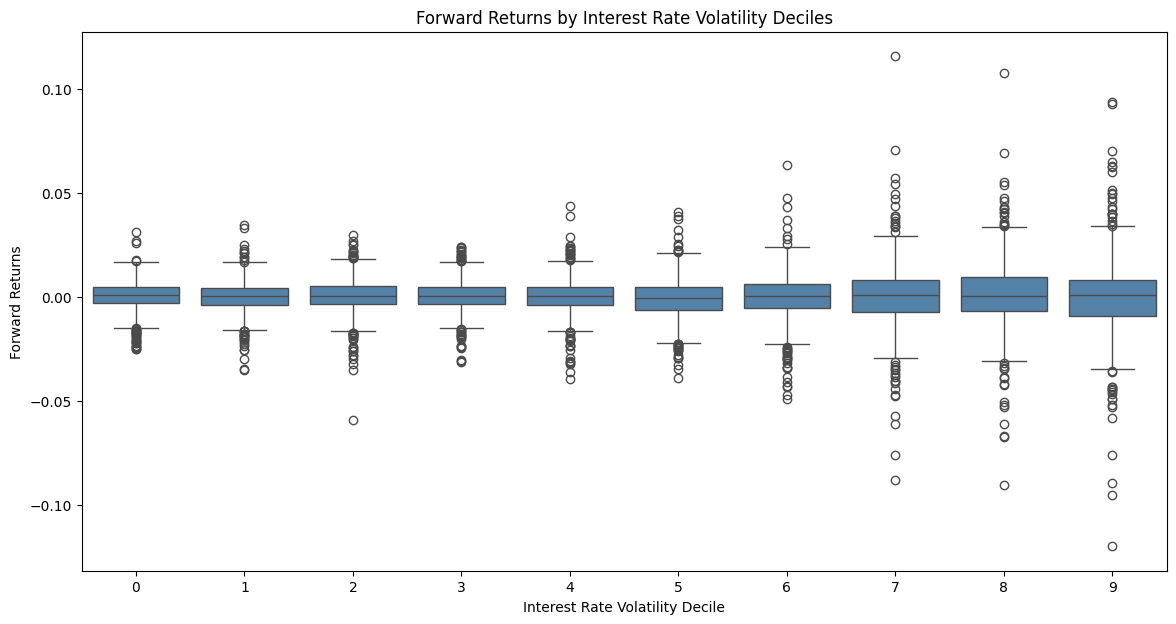
To explore the relationship between interest rate volatility and stock returns, we initially performed a regression analysis with forward returns as the dependent variable and interest rate volatility as the independent variable. However, our focus shifted to examining the impact of interest rate volatility on the volatility of forward returns, as this provides a deeper understanding of market dynamics under changing interest rate conditions.
The regression results reveal a statistically significant relationship between interest rate volatility and the short-term 7-day forward return volatility. The coefficient for interest rate volatility (Volatilityir) is 0.0483, with a t-statistic of 30.938 and a p-value less than 0.001, indicating a highly significant positive impact. The R-squared value of 0.143 suggests that approximately 14.3% of the variation in forward return volatility can be explained by changes in interest rate volatility.
OLS Regression Results
| Coefficient | Std. Error | t-Statistic | p-Value | [0.025, 0.975] Interval | |
|---|---|---|---|---|---|
| const | 0.0048 | 0.000 | 24.167 | 0.000 | [0.004, 0.005] |
| Volatilityir | 0.0483 | 0.002 | 30.938 | 0.000 | [0.045, 0.051] |
GARCH Model
The GARCH (Generalized Autoregressive Conditional Heteroskedasticity) model is used in time series analysis to estimate the volatility of returns. In our GARCH model, the conditional variance is a linear function of past squared innovations and previous own lags.
This model is particularly useful for financial time series data, which often exhibit volatility clustering, meaning periods of high volatility are followed by more periods of high volatility and vice versa.
Key Components of the GARCH Model
- Mean Model (Constant Mean): Specifies the average return of the time series.
- Volatility Model (GARCH): Captures the conditional variance (volatility) of the series, which changes over time.
- omega (ω): The constant term in the volatility equation.
- alpha (α): The coefficient for the lagged squared returns (ARCH term).
- beta (β): The coefficient for the lagged conditional variance (GARCH term).
Results Explanation
| Coefficient | Std. Error | t-Statistic | p-Value | [0.025, 0.975] Interval | |
|---|---|---|---|---|---|
| omega | 0.0006 | 0.000 | 0.679 | 0.497 | [0.000, 0.001] |
| alpha | 0.0365 | 0.012 | 2.964 | 0.003 | [0.012, 0.061] |
| beta | 0.9351 | 0.012 | 78.145 | 0.000 | [0.912, 0.958] |
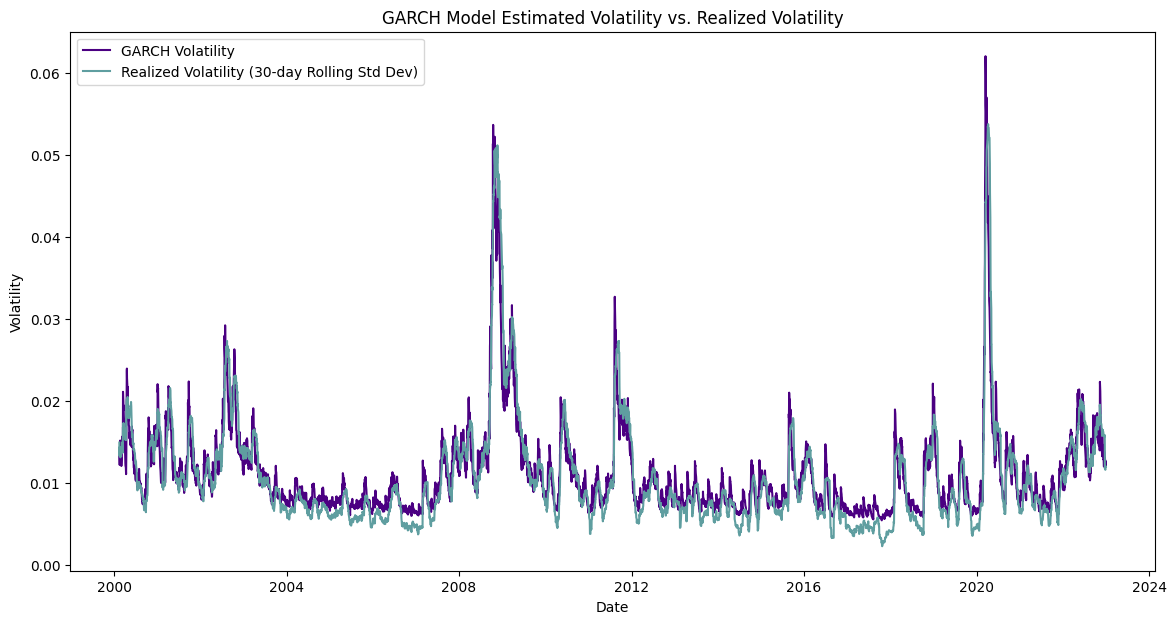
The GARCH model analysis reveals important insights into the volatility dynamics of S&P 500 returns. The coefficients obtained from the model highlight several key aspects of volatility behavior. The constant term, omega (ω), is 0.0006, though not statistically significant (p-value = 0.497), indicating that the base level of volatility is pegged to baseline. The coefficient for alpha (α), at 0.0365 with a p-value of 0.003, shows that approximately 3.65% of the variance in current volatility can be attributed to past squared returns, underscoring a modest effect of recent shocks on volatility. More notably, the coefficient for beta (β) is 0.9351, with an exceptionally low p-value (0.000), indicating that 93.51% of the volatility from previous periods carries over to the current period. This high beta value suggests a significant persistence in volatility, meaning once volatility is high, it remains elevated for a substantial period. The sum of alpha and beta (0.9716) being close to 1 further supports this, indicating strong volatility clustering where periods of high volatility tend to be followed by more high volatility. These results highlight the self-dependent nature of volatility as captured by the GARCH model, emphasizing its ability to reflect the time-varying dynamics of financial volatility. This insight is essential for investors aiming to understand and manage the risks associated with persitancy in of interest rates fluctuations and stock market returns.
Impact of Interest Rate on Asset Classes
Heightened interest rate volatility tends to affect bonds and stocks differently. Historically, periods of high interest rate volatility have not been immediately detrimental to bond performance. For instance, during the financial crisis of 2008 and the COVID-19 pandemic in 2020, elevated volatility was accompanied by strong bond returns. However, these periods were often followed by negative bond performance as the market adjusted to new economic realities. In contrast, stocks tend to suffer more directly from increased uncertainty, as higher discount rates and risk aversion lead to lower valuations.
The impact of interest rate volatility on stock returns can be attributed to the increased uncertainty and risk associated with volatile interest rates. Investors demand a higher risk premium, leading to a decline in stock prices. Furthermore, the heightened volatility in stock returns reflects the market's adjustment to new information about interest rate changes.
Broader Economic Implications of Interest Rate Changes
In a broader economic context, interest rates can have distributional consequences that extend beyond the headline impacts typically captured by metrics such as GDP growth. These effects are particularly pronounced in both the household and corporate sectors. Weaker companies, often burdened with more floating-rate debt, face increased interest costs as rates rise, while stronger companies remain relatively insulated due to their more stable financial positions. Similarly, lower-income individuals, who tend to carry more debt, are more vulnerable to rising interest rates, whereas wealthier individuals benefit from higher returns on their interest-bearing assets.
This phenomenon also highlights the volatility and fragility of the narratives surrounding market movements. For instance, in 2018, when the 10-year Treasury yield surpassed 3%, the Nasdaq 100 significantly underperformed the S&P 500 during the market downturn. The prevailing view was that highly valued megacap firms were more susceptible to a valuation reset driven by higher rates. This event underscores how changes in interest rates can have far-reaching consequences, reshaping economic dynamics and market expectations.
Conclusion
As we currently experience elevated interest rate volatility, particularly at the shorter end of the yield curve, investors face a complex landscape. The Federal Reserve's potential rate cuts are anticipated to provide some relief to the economy, but they also introduce new uncertainties. For stocks, this volatility suggests a bumpy road ahead, with potential short-term declines but opportunities for strategic positioning. For bonds, while the immediate impact may not be negative, it is crucial to remain vigilant for potential adverse effects in the medium to long term.
If interest rate becomes more volatile it would also increase the volatility of conditional stock returns. The prominent relationship between interest rate volatility and stock returns underscores the importance of stable macroeconomic policies. As the Federal Reserve considers rate cuts, understanding these dynamics becomes even more critical. Investors should navigate this environment with a keen eye on both short-term fluctuations and long-term trends, ensuring they are prepared for the potential changes ahead.